Python in the Blind Audio Tactile Mapping System
| Category: | Software Development, Education, Science |
|---|---|
| Keywords: | Accessiblity, User Interface, Post Secondary, Scientific Programming, Assistive Technologies, GIS and Mapping, Python on Window |
| Title: | Python in the Blind Audio Tactile Mapping System |
| Authors: | Chad Haynes and Thomas Logan |
| Website: | http://www.cs.unc.edu/assist |
| Date: | 2003/01/17 15:59:01 |
| Summary: | The Blind Audio Tactile Mapping System uses Python to provide access to maps for the blind and visually impaired. |
Introduction
The Blind Audio Tactile Mapping System (BATS) seeks to provide access to maps for the blind and visually impaired. Our goal is to devise ways to present traditionally visual information to the user's other senses. The need for this project became clear when Jason Morris came to the University of North Carolina at Chapel Hill to study Classics. Morris works at the Ancient World Mapping Center (AWMC), a foundation to advance the field of ancient studies with the use of cartography and geographic information science. Morris, who has been blind since an early age, has faced the denial of access to information critical to his choice of study for the majority of his life. With his work at the AWMC he vowed to create a solution.
Morris' chance meeting with Gary Bishop, Associate Professor of Computer Science, set the project in motion. Bishop had been seeking users who could benefit from the development of assistive tools customized for their needs. At the time of their meeting, there were no maps of the ancient world in a format accessible to the visually impaired. After their initial conversation, Dr. Bishop created the opportunity for a team of undergraduate students to implement a solution in a semester-long software engineering course. We were fortunate to be part of the five-person team assembled to work on this exciting project.
The goal of the software engineering course, taught by Associate Professor Kye Hedlund, was to teach students about working collaboratively, identifying goals, and meeting deadlines. Our team began by meeting with our three advisors to talk about initial design decisions. Professor Bishop presented us with Dr. Dan Jacobson's paper Navigating maps with little or no sight: An audio-tactile approach as a basis for developing a tool that provided access to spatial information through sound and touch. The core components of our system were a Pentium III computer running Windows 2000, a touch pad as the primary input device, and the Microsoft Speech SDK 5.1 to communicate information with a synthesized voice.
Choice of Python
Faced with the daunting task of coding a program with little precedent, the first major design decision our team had to tackle was the choice of a programming language. Our initial thoughts were to use either C++ or Java since everyone in the group was proficient with both. One group member had been exposed to Python in an earlier class and was impressed with the power and ease of use it provided. The fact that the other four members had no experience with the language fortunately did not stop us from making the wise decision to use Python.
Very early in the development we required a simple program to test how the touch pad interacts with the operating system. This proved incredibly easy with wxPython, a Python wrapper for the powerful wxWindows GUI toolkit. Setting up a frame to take full control of the screen was very straightforward and required minimal coding.
Given our strict time constraints, a language that allowed for rapid development such as this was a great advantage. No one in the group at that time had any real concept of the extent to which we would be able to use Python in the project. However, as we discovered the extensive collection of libraries and modules available for it, we decided that Python could be used exclusively.
Implementation
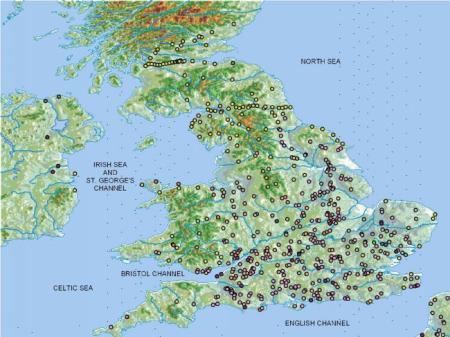
Our next meetings were with Tom Elliott, the Director of the Ancient World Mapping Center, who conveniently holds an undergraduate degree in Computer Science. He introduced us to the Barrington Atlas, a twelve year undertaking that culminated with the first comprehensive maps of ancient Greek and Roman civilizations to be produced since 1874. The Ancient World Mapping Center is now digitizing all the information contained in this atlas, making the information held within it into an even richer educational tool. The British Isles were selected as the prototype map. Our discussions centered on translating the visual representation of the image and its underlying database information into a format our program could use.

Test map for the BATs system Zoom in
Elliott provided the first two data files for BATS using ArcView, a powerful tool for working with maps. Two ASCII text files were produced, indicating the surface type and elevation of our map. The information had been formatted as a grid of 1024 columns and 768 rows to match the resolution of our display and touch pad. We decided to read this grid of numbers into Numeric arrays in Python.
Originally quite a bit of preprocessing was involved to scale down the data to fit our internal model. We did not want to go through the reading and scaling process every time the program was launched because it was quite time consuming. Instead we were able to read and scale the data once, then Pickle the internal structure to a compressed file. Now the program had only to decompress the data and load it directly into the appropriate data structure, resulting in a significant reduction in startup time.
The loaded grid enabled a one-to-one correspondence between a pixel in our image and a value in the text file. We envisioned that the user would receive constant feedback through the audio device about their current location on the map by associating sounds with surface types. Our next concern was whether Python could retrieve the information from the data structure fast enough to provide responsive feedback to our end user. Python was however able to execute these operations smoothly and enabled us to give immediate aural feedback about the surface type. Watching the user's cursor on the screen we saw that upon entering the ocean area, the program's sound output was immediately switched to the sounds of waves, and when re-entering land the sound switched again without delay. The user had begun his first digital exploration of the shape of the land of the British Isles. Elevation could also be read for every point in the map without any computational pauses.
Our system consists of two major components, a graphical user interface and a data manager. The user interface interacts with the data through the data manager. Our interface uses only a touch pad and a number keypad to assist visually impaired people with minimal computer experience. As the user moves around the touch pad the wxPython Mouse Motion Event triggers a query of the surface type table and the city database. Python allowed us to quickly reassign and test combinations of key and mouse events.
The user interface involves the touch pad, the number keypad, and a voice synthesizer to provide feedback. The mouse and key events were handled by wxPython, but we also needed to call Microsoft's Speech API. We did this using Mark Hammond's win32com module, which allowed us to create a voice and produce speech in only three lines of code.
The data manager maintains the data in three Numeric arrays and an ODBC database connection created using the win32all package. The three arrays are used to store the altitude, land type, and a database key value. The decision to query the Microsoft Access database directly from BATS was made very close to our project deadline. Again Python enabled our team to implement the idea quickly and successfully. Queries to the Access database are done through an ODBC connection using the value from the database key array to determine what city information is associated with a given location. The ability to run queries on the database greatly extended the educational value of this tool by allowing for the dynamic creation of maps.
Results
At the completion of our semester we had created a tool that allowed exploration of complex map information. All of the information that could have been gained by looking at the map could now be gained in a similar way through listening to a synthesized voice and sound icons. Our map also provided for the immediate communication of distances between any two locations without having to rely on a table for calculations. The ability to hear the periods of existence, type and name of settlements extended the use of the map beyond what is available in a strictly visual rendering. Morris was able to use our project as a resource in writing a graduate level paper for the Classics Department.

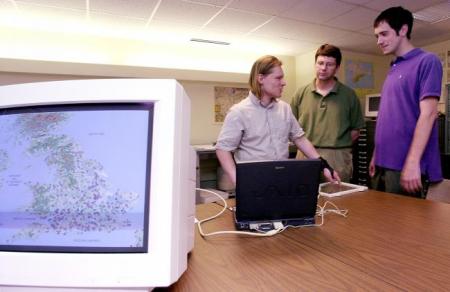
Jason Morris (left) works with BATS with Tom Elliott (center) and Thomas Logan (right) Zoom in
Python allowed us to prove that this type of data manipulation for maps is possible and allowed us to create a powerful demonstration to get others excited about the project. We had the opportunity to demo our software during presentations throughout the course of the semester. During our preparations just prior to a presentation, a previously unnoticed bug would invariably appear. We found that these bugs could be located and resolved very quickly with Python, which reports the line number and stack trace to the point where the error occurred. There is no need to compile code or set up complex links between libraries. Since everything is interpreted at runtime, we were able to continue rapid development without being bogged down by complex syntactic problems or slowed by compile times.
The ability to quickly tailor a demonstration for a particular audience was also an advantage of Python. When presenting our project to a group of orientation and mobility instructors and their visually impaired students we were able to quickly create a map of North Carolina that would be more familiar than that of Ancient England. Once we had an understanding of how all the pieces should fit together, Python provided an environment to stitch the program together easily. The demos we were able to produce helped us secure a Microsoft Research grant to further the project. These demonstrations have also attracted the interest of the media, which is helping to publicize the need for maps for the blind.
Python also made it very easy to integrate other programmers' modules into our code. We have and are continuing to experiment with the Python Imaging Library, pyXML, and Numeric. Professor Bishop and graduate student Peter Parente enabled use of the OpenAL library for spatial sound and the Immersion library for haptic feedback from Python. This was done with SWIG, which allows for the automated development of Python language bindings for C and C++ code.
The BATS team is now working on taking aspects of the program to local high schools. We believe that it will be easy to illustrate the concepts of accessible design through Python's easy to read code. We hope to get many students excited about the possibilities of assistive technology and to foster a community of people working on open-source solutions. If you would like to become involved please check the Assistive Technologies site at http://www.cs.unc.edu/assist .
About the Authors
Chad Haynes is living in New York City and working as a Research Programmer at The Rockefeller University.
Thomas Logan currently lives in Seattle, Washington and works for the Microsoft Corporation as a Program Manager in the Accessible Technologies Group.

